dxw’s tech days

What we did during our last dxw tech days, and how we can make the next ones even better
Working as a technologist at dxw, you spend most of your days on client projects in distributed multidisciplinary teams.
And because you spend most of your working hours delivering features for the client in your project team, it can be easy to forget that you’re part of a wider agency, and that people and projects outside your bubble exist.
There’s a real wealth of talented developers at dxw, and despite being here for over 2 years, I’ve only worked on client projects with a handful of them.
For me, the biggest perk of being a developer is learning new things, usually from other people who:
- might have more experience than you
- might have used a particular tool you’ve never heard of before that could change your working life
- have just discovered a new way of solving a problem
So how do you bring together a group of mostly remote people with a variety of skill levels spread across various client projects and grow a technology team?
By locking them in a (virtual) room and forcing them to work together to solve a problem!
Taking a break from client work
Last year, we took a break from our client projects for 2 days to work together on internal-facing projects focused around measuring the success of our software development processes.
Different teams might have different ways of building software. So monitoring how successful our development processes are for each project, whether that’s a client project, a service we host as part of a support contract, or an internal-facing application, can tell us what’s working well, where we might be able to improve things, and what projects might need more support or resources.
We started the day with a tech team forum to pick some key areas to focus on measuring:
- how long it takes changes to go from a card being picked up on Trello to it going live in production
- how frequently we’re deploying our projects to production
- the quality of our pull requests (branches of code waiting to be reviewed by another developer before being merged into the main codebase)
Then we split into 3 groups to focus on one of these topics. The overarching goals of the day were to:
- provide “safe” projects for people to try new technology or project roles
- share knowledge with each other
- work with different people
- make something at dxw better
Measuring deployment frequency
I was part of the group focused on measuring how regularly we deploy our projects to production.
Small, frequent deployments are usually a ‘good thing’ as they show we’re constantly iterating and (hopefully) improving a service. Any bugs that may have slipped in can be rolled back, or quickly patched in the next small deployment.
A service that isn’t being regularly deployed to production, on the other hand, may not have had its dependencies updated in a while (and could therefore have security vulnerabilities). It could be outdated in terms of user needs, which would nudge us to make further iterations. Or it might inform us that the service isn’t being used at all, particularly if it’s an internal tool we’ve built, so we might be able to get rid of it and save on resources.
How did we approach it?
We started with a planning session, where we decided on a broad goal for the day: to visualise past, present and future deployment data on a dashboard. This would allow us to see, at a glance, which projects are being regularly deployed and which might have gone stale and need some attention.
After deciding on this goal, we had a brief discussion about the steps we’d need to take to get there and captured key decisions, and tasks, in various Trello cards.
The planning session was a good representation of our usual “sprint planning” meetings, but without a Delivery Lead present to help keep discussion on track, it was up to us to fulfil this role, and make sure that there was a shared understanding of what would be involved.
The work streams
In the end, we decided on 3 streams of work that could be worked on in parallel:
- fetch historical deployment data from one or more of our projects (hosted on a variety of different platforms)
- set up a script for exporting present and future deployment data whenever a deployment takes place on one of our projects (set up across multiple CI platforms)
- visualise this data on a dashboard. We opted for InfluxDB, a “time series database” that for our case would allow us to create a dashboard of deployment data with a pin for each deployment on a graph over a selected timeline
We split into 3 smaller groups and paired or “mobbed” on these tasks, with catch-ups with the rest of the group scheduled every couple of hours to surface any blockers and keep everyone up to date with our progress.
We had a deadline of Friday afternoon’s Show & Tell to have something to present to the wider technology team, and there was a lot to cover in a small amount of time, so we had to really prioritise effectively.
We were working right up to the line, but by 4pm on Friday, we’d managed to get some data exported from our deployment pipelines and showing on Influx DB, albeit not in the most human-readable way…
Here’s the dashboard showing the frequency of deployments over rough “epoch time” (the number of seconds that have elapsed since 1 January 1970, because “computers”) on our client projects:
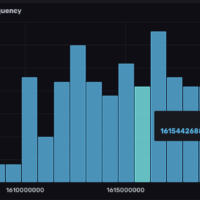
Deployment frequency for the BEIS RODA project
It’s not the easiest thing to read at a glance, but essentially shows how many deployments took place between each epoch time. I’m sure you’ll agree it’s definitely a work in progress!
What went well
Although we didn’t ‘finish’ our task, I learnt a lot during the project – it was great to work with different people, trying out new things in a safe environment.
I’d not had a lot of experience with data visualisation platforms and deployment pipelines, so being exposed to the internals of how those things work was a really valuable learning experience.
I felt we planned the work really well – splitting out into smaller groups to focus on one of 3 tasks in parallel allowed us not to tread on each other’s toes when building.
Regular catch-ups ensured we weren’t going to be stuck on something for too long, and could get help if needed from members of the other groups who might have a bit more knowledge about the tool we were using.
It was great to see more senior members of the team pairing with some of the more junior developers. Because, often on client work, there’s not a lot of time to spend pairing with one other person and learning from them.
How we could make the session even better
In terms of personal development, I felt the planning session would have been a great way for members of the team with less technical leadership experience to get some practice with some of the tasks involved in being a Tech Lead. Things like breaking tasks down into workable chunks, ensuring we weren’t putting too much on our plate for the day’s work, and making sure everyone knew what was expected of them.
I’d have liked us to pick 1 or 2 people to act as ‘leads’ beforehand, and for them to feel safe in the knowledge that they could ask the more senior members of the team for support if they needed it.
If we’d had a bit more time, I’d also possibly have liked to rotate pairs around the group. Because we didn’t all get as much exposure to how Influx works, particularly on the data export teams, so it was a bit difficult to imagine how this data would be interpreted by Influx.
Let’s do this again sometime
Overall, I felt the Tech Days were a great way of bringing the technology team together without some of the pressures that come with working on a client project.
Pairing with people with different skill sets gave us exposure to other parts of the technology stack that we might not normally have touched.
Although we didn’t all end the day with finished, working software, it was satisfying to have something to show for the day (in our case, a barebones dashboard). And great to have something that we could iterate on in future dxw time (the time where we focus on internal projects), or in a future Tech Day.