Drawing out the context of data: a sketching how to guide

Sometimes we get more insight from a single drawing than a detailed page of notes
We’ve been working with the Maritime and Coastguard Agency (MCA) for about a year and were delighted when they asked us to help them define their 5 year strategy for technology and data for the Coastguard directorate.
We needed to understand the people using the various systems and what challenges they face before considering areas to improve. This drawing exercise along with other outputs, helped us to see the bigger picture of technology usage within the Coastguard.
The insights from the sketches are invaluable. We’ll communicate them to decision makers to ensure everyone is on the same page, understands user needs and the issues they are facing.
Why we picked drawing
Imagine that you’re the holder of the IT budget. You want to help everyone, but there’s only so much money. One team is complaining that some of the databases, while functional, are clunky. Do you update them or do you pick something else?
The answer is (as always), it depends. For you to make the right decision you need more information. You need to know the context in which they work and what the implications are of the database not being optimal. A bit of empathy for the user certainly helps too.
Drawing is a way to help (bad pun alert) draw out that context. While a picture is supposedly worth a 1,000 words, it’s merely a snapshot in time.
A drawing can go further and include:
- what happens before and after
- what’s happening in the background
- what the external pressures are
- the feelings involved
- what relationships are factors
- what’s connected
So drawing can be a useful tool when we want to learn more about data.
10 tips on getting people to draw
Show them yours
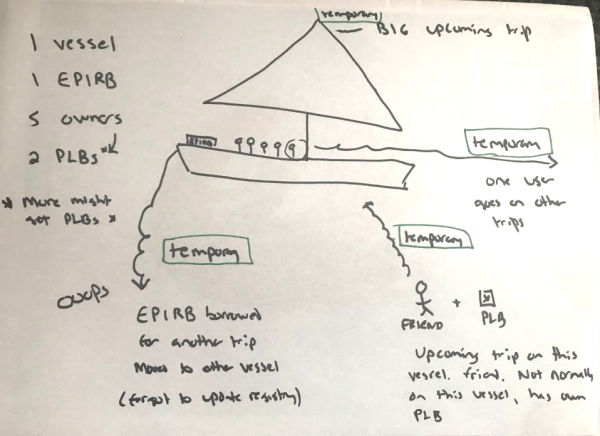
I had drawn a sketch of the complexities of beacon ownership for another MCA project and showed that as an example of the kind of quality (or lack of) for a benchmark. Concept over quality is what you want here.
Explain why
People are in the room because they’re the subject matter experts. Not us. They are the ones who experience their jobs everyday and know the ins and outs, the context, the feelings they have when using a system, better than anyone.
We made sure they knew how valuable their insight was to determine the strategy both at the start of the workshop and again in the task intro. People want to contribute when they see the value and when they feel they are being listened to.
No wrong answer
There’s no right or wrong answer in user research in general. But for the drawing exercise we went beyond that. Participants could draw the good or the bad. We encouraged participants to speak up no matter how small a problem may seem.
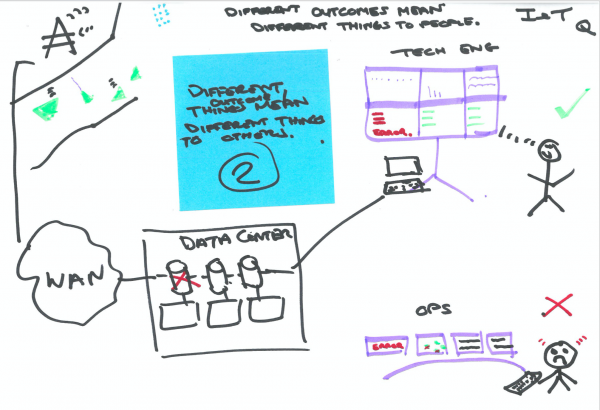
Some people drew systems that they liked, some focussed on system specifics like beeping alerts or missing data, others focussed on overall joined processes and more conceptual concerns. They all have a place conveying the overall picture of technology within Coastguard.
Give them colour
We put Sharpies and packs of markers on all the tables. Some people thought about their systems with traffic light (red/green) coding and others got really creative with using colour in labelling. Let them do whatever they want. Also accept that one or two people will do their whole drawing in neon green.
Remember the goal is to get people to convey the concept in any way that’s clear.
It doesn’t have to be “a picture”
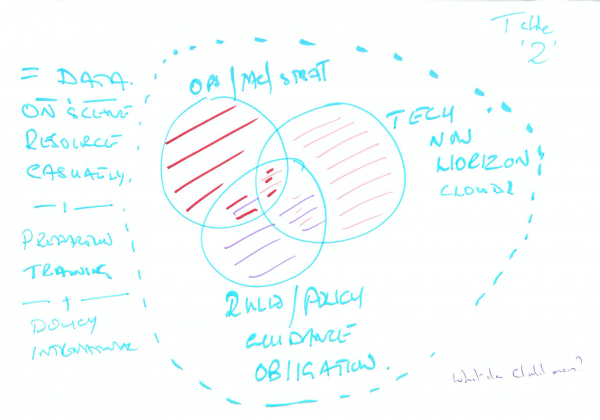
Our client was initially worried people wouldn’t want to draw or would be too shy. To mitigate this, I offered other options like a flowchart or a Venn diagram or even just some words on the page. Some people drew themselves surrounded by words like a persona. We had lots of arrows which was great to show what data was being used, where it’s coming from, or going to.
Drawings can take a variety of forms. Be flexible.
Draw together, draw for someone
Not everyone drew something. Some people drew in small groups and had the “best” drawer do it while they contributed ideas. That’s fine! One person still wasn’t sure. They were at a table that was being really creative with markers, so I took them to a table doing data flow type drawings and then to someone doing a persona. They said as someone in IT who handles Coastguard’s requests they were 60% reactive and 40% proactive – so I drew that for them. Make sure you work with the words people use.
Use captions
With so many drawings and such a disparate group of subject matter expertise, it was important to make sure everyone could understand what had been drawn. We asked anyone who hadn’t included a title or a very clear topic to use a blue sticky note to tell us what we were looking at. The nice thing about the sticky note is that it can be removed if needed and the original restored.
Put them up
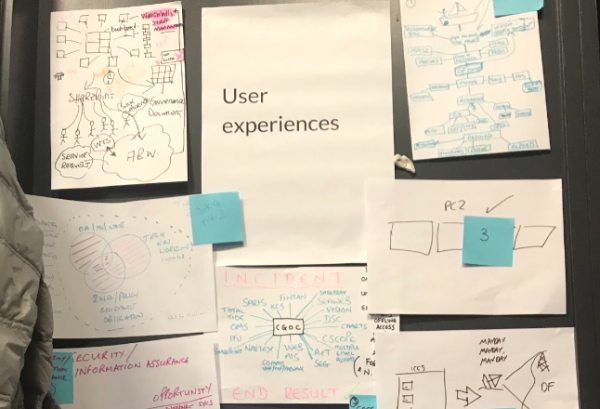
While some people happily stood up and told us what they had drawn, with 30+ people and lunch ready, we also opted to put everything up on the wall. Seeing the drawings all together was quite powerful and provided conversation points throughout the day. Because they had been captioned people could have a look at their own pace and get an understanding of other areas.
Don’t throw the work away
Often outputs of workshops are disposable and exist only to get you to the next activity, but drawings can have some longer term uses. We chose to scan them all, as well as creating a spreadsheet with the various themes. The workshop was over a month ago now and we’ve gone back several times for reference.
Sometimes we get more insight from a single drawing than a detailed page of notes. We’ve also used them to get team members up to speed quickly and to check our understanding of something complex later on.
Feed them
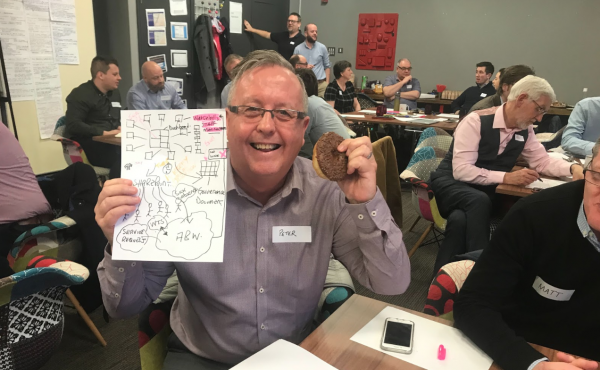
I’m a firm believer in workshop snacks, always. But if you’re asking someone to go above and beyond and be vulnerable in front of their colleagues, then you must up the quality of the snacks. This calls for donuts. Remember, happy participants are open and contributing participants.
Learn more
If you want to learn more about storyboarding in workshops or drawing with stakeholders, there’s plenty of resources available.